This page presents an analysis of LeBron James' career statistics using three different charts.
| Season | Team | PPG | RPG | APG | FG% |
|---|---|---|---|---|---|
| 2003-04 | Cleveland Cavaliers | 20.9 | 5.5 | 5.9 | 41.7% |
| 2004-05 | Cleveland Cavaliers | 27.2 | 7.4 | 7.2 | 47.2% |
| 2005-06 | Cleveland Cavaliers | 31.4 | 7.0 | 6.6 | 48.0% |
| 2006-07 | Cleveland Cavaliers | 27.3 | 6.7 | 6.0 | 47.6% |
| 2007-08 | Cleveland Cavaliers | 30.0 | 7.9 | 7.2 | 48.4% |
| 2008-09 | Cleveland Cavaliers | 28.4 | 7.6 | 7.2 | 48.9% |
| 2009-10 | Cleveland Cavaliers | 29.7 | 7.3 | 8.6 | 50.3% |
| 2010-11 | Miami Heat | 26.7 | 7.5 | 7.0 | 51.0% |
| 2011-12 | Miami Heat | 27.1 | 7.9 | 6.2 | 53.1% |
| 2012-13 | Miami Heat | 26.8 | 8.0 | 7.3 | 56.5% |
| 2013-14 | Miami Heat | 27.1 | 6.9 | 6.3 | 56.7% |
| 2014-15 | Cleveland Cavaliers | 25.3 | 6.0 | 7.4 | 48.8% |
| 2015-16 | Cleveland Cavaliers | 25.3 | 7.4 | 6.8 | 52.0% |
| 2016-17 | Cleveland Cavaliers | 26.4 | 8.6 | 8.7 | 54.8% |
| 2017-18 | Cleveland Cavaliers | 27.5 | 8.6 | 9.1 | 54.2% |
| 2018-19 | Los Angeles Lakers | 27.4 | 8.5 | 8.3 | 51.0% |
| 2019-20 | Los Angeles Lakers | 25.3 | 7.8 | 10.2 | 49.3% |
| 2020-21 | Los Angeles Lakers | 25.0 | 7.7 | 7.8 | 51.3% |
| 2021-22 | Los Angeles Lakers | 30.3 | 8.2 | 6.2 | 52.4% |
| 2022-23 | Los Angeles Lakers | 28.9 | 8.3 | 6.8 | 50.0% |
| 2023-24 | Los Angeles Lakers | 25.7 | 7.3 | 8.3 | 54.0% |
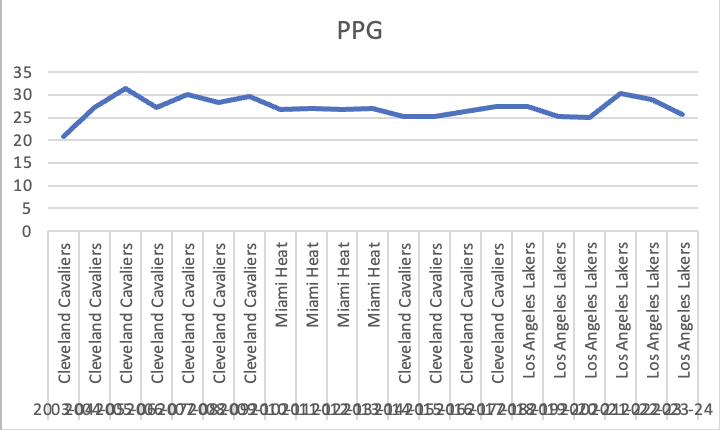
LeBron James' PPG peaked in 2005-06 and remained consistently high throughout his career.
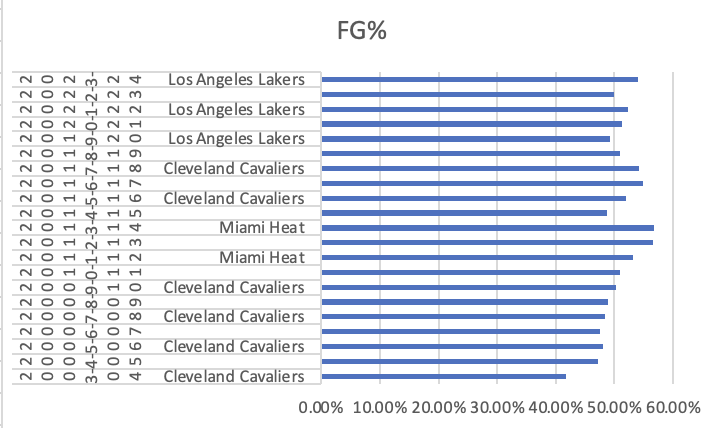
LeBron's FG% significantly improved during his Miami Heat years, showing increased efficiency.
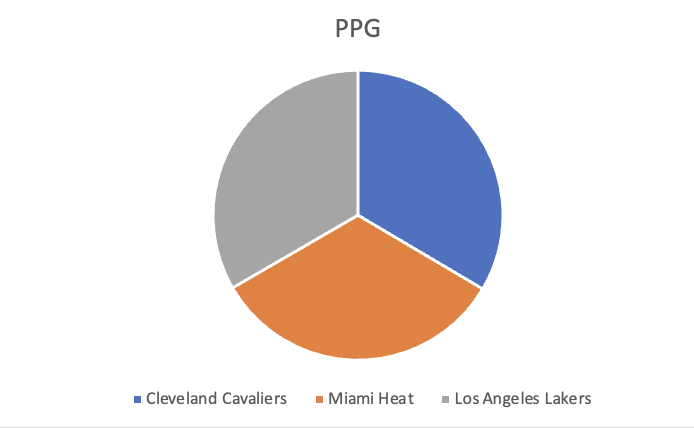
The pie chart highlights LeBron's scoring contributions across different teams, with a balanced distribution.